Debugging
Running with the debugger
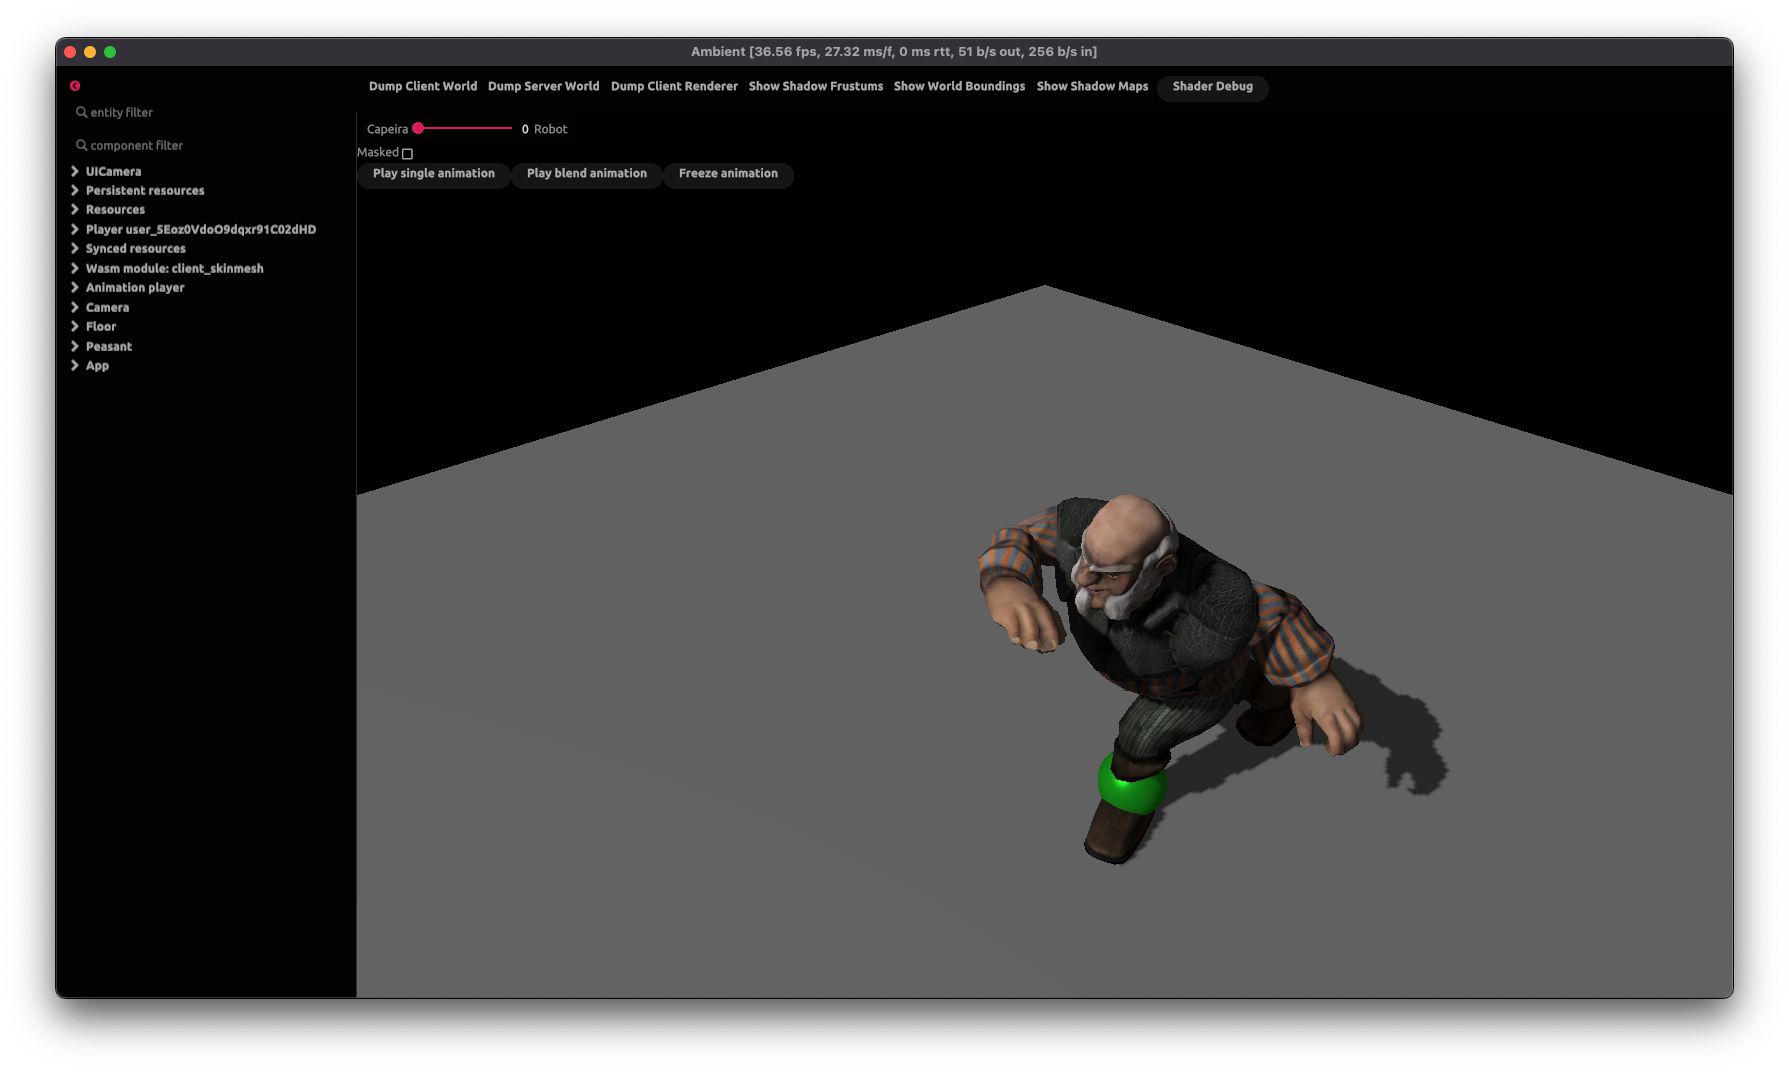
When the client is run with the AMBIENT_DEBUGGER environment variable, or with the --debugger flag, the game is surrounded with a debugger:
AMBIENT_DEBUGGER=1 ambient run examples/minigolf
# or `$env:AMBIENT_DEBUGGER=1` on Windows/PowerShell
# or `ambient run --debugger examples/minigolf`

These can be used to inspect the state of the client and server ECSes, as well as the renderer. When one of these buttons are pressed, a YAML file will be created with the corresponding state, and its path will be written to stdout:
[2023-02-23T17:47:36Z INFO ambient_debugger] Wrote "Ambient/tmp/server_hierarchy.yml"
Here is some sample output for the server ECS:
- "id=RsE148MNkdB24bFWQrfeMA loc=48:0":
    "core::app::main_scene": ()
    "core::ecs::children": "[EntityId(koK-dbeCZDrcHzsT7QELUw, 110383077981027712353063371358575952530)]"
    "core::transform::translation": "Vec3(-5.0, -0.0019752309, 2.8536541)"
    "core::transform::scale": "Vec3(1.0, 1.0, 1.0)"
    "core::transform::rotation": "Quat(0.0, 0.0, 0.0, 1.0)"
    "core::transform::local_to_world": "Mat4 { x_axis: Vec4(1.0, 0.0, 0.0, 0.0), y_axis: Vec4(0.0, 1.0, 0.0, 0.0), z_axis: Vec4(0.0, 0.0, 1.0, 0.0), w_axis: Vec4(-5.0, -0.001970334, 2.8387475, 1.0) }"
    "core::transform::spherical_billboard": ()
  children:
    - "id=koK-dbeCZDrcHzsT7QELUw loc=46:0":
        "core::app::main_scene": ()
        "core::transform::local_to_world": "Mat4 { x_axis: Vec4(0.02, 0.0, 0.0, 0.0), y_axis: Vec4(0.0, -0.02, 1.7484555e-9, 0.0), z_axis: Vec4(0.0, -1.7484555e-9, -0.02, 0.0), w_axis: Vec4(-5.0, -0.001970334, 2.8387475, 1.0) }"
        "core::transform::local_to_parent": "Mat4 { x_axis: Vec4(0.02, 0.0, 0.0, 0.0), y_axis: Vec4(0.0, -0.02, 1.7484555e-9, 0.0), z_axis: Vec4(0.0, -1.7484555e-9, -0.02, 0.0), w_axis: Vec4(0.0, 0.0, 0.0, 1.0) }"
        "core::transform::mesh_to_local": "Mat4 { x_axis: Vec4(1.0, 0.0, 0.0, 0.0), y_axis: Vec4(0.0, 1.0, 0.0, 0.0), z_axis: Vec4(0.0, 0.0, 1.0, 0.0), w_axis: Vec4(0.0, 0.0, 0.0, 1.0) }"
        "core::transform::mesh_to_world": "Mat4 { x_axis: Vec4(0.02, 0.0, 0.0, 0.0), y_axis: Vec4(0.0, -0.02, 1.7484555e-9, 0.0), z_axis: Vec4(0.0, -1.7484555e-9, -0.02, 0.0), w_axis: Vec4(-5.0, -0.001970334, 2.8387475, 1.0) }"
        "core::rendering::color": "Vec4(1.0, 0.3, 0.3, 1.0)"
        "core::ui::text": '"user_470i61dDp7FKjGFQetZ53O"'
        "core::ui::font_size": "36.0"
        "core::player::user_id": "..."
      children: []
Increasing log output
You can also increase the logging output from specific internal modules using the RUST_LOG environment variable,
which accepts module=log_level pairs that are comma-sepparated. Here are some general tips:
- To debug your asset pipeline, set
RUST_LOG=ambient_build=info. For even more logs, you can setRUST_LOG=ambient_build=info,ambient_model_import=info. - To debug rendering, set
RUST_LOG=ambient_renderer=info. - To debug networking, set
RUST_LOG=ambient_network=info. - To debug physics, set
RUST_LOG=ambient_physics=info. - To debug everything, set
RUST_LOG=info. To get even more logs setRUST_LOG=debug.
Physics
Ambient uses PhysX 4.1 from Nvidia for physics simulation. As a result, the entire physics scene can be visualized using the PhysX Visual Debugger (PVD).
By default, physics debugging is on. To debug your scene, install and start PVD, then start an Ambient package. Your package’s scene should automatically be visible within PVD. For more details on how to use PVD, see the guide.
Assets
When assets are compiled by the assets pipeline, the resulting artifacts will be output to the build directory in your package. These can be examined to determine whether or not your source was accurately compiled by the asset pipeline.
Additionally, if there are fatal errors or warnings, the asset pipeline will report them during the compilation process.
Networking
Debugging which components are sent over the network
Use the environment flag AMBIENT_DEBUG_ENTITY_STREAM to debug entities and components sent over the network to the client. AMBIENT_DEBUG_ENTITY_STREAM=FULL will output everything, AMBIENT_DEBUG_ENTITY_STREAM=true (or anything else) will output a summary.